You just downloaded a LUT pack. There are 30 presets, they all have cryptic names like CIN_D65_WARM_v3.cube, and you have no idea which one to use. The conventional approach is to apply each one to your footage and scrub through until something looks right. That works. But there is a faster and considerably more informed way.
A LUT analyzer lets you read what a LUT actually does before you apply it: its contrast curve, colour temperature bias, saturation response, gamut compression, and clipping behaviour. Professional-grade analysis includes perceptually uniform colour metrics (ΔE2000), gamut volume profiling via Jacobian determinant, pixel-level inspection, broadcast-grade scopes, and dual-LUT comparison. Once you master these signals, selecting the right LUT takes seconds rather than minutes - and you stop making grading decisions by feel alone.
This guide walks through the free LUT Cube Analyzer at alestemple.net - a fully browser-based tool that works with any standard .cube file (17³ to 65³, up to 20 MB), runs entirely on your device, and requires no account or software installation. It covers all six analysis tabs, advanced features, practical use cases, and a 60-second evaluation workflow you can start using immediately.
- What Is a .cube LUT File?
- Technical Specifications
- Getting Started in 30 Seconds
- Feature Comparison: What Each Tab Does
- Tab 1 – 3D Cube: Spatial Gamut Analysis
- Tab 2 – Curves: Tonal Behaviour
- Tab 3 – Preview: Pixel Inspector & Clip Warning
- Tab 4 – Scopes: Broadcast-Grade Signals
- Tab 5 – LUT DNA: Automatic Fingerprinting
- Tab 6 – Compare: Dual-LUT Analysis
- Professional Use Cases
- 60-Second Evaluation Workflow
- Advanced Features FAQ
What Is a .cube LUT File?
A .cube file is the industry-standard container for 3D Look-Up Tables. It stores a three-dimensional colour remapping grid: for every possible combination of Red, Green, and Blue input values at a given resolution (typically 33 grid points per axis, but ranging from 17 to 65), it specifies the output RGB values the NLE or colour grading software should produce.
The format is used by virtually every professional tool: DaVinci Resolve, Vegas Pro, Adobe Premiere Pro, Final Cut Pro X, After Effects, Lightroom, Capture One, and Photoshop all read .cube files natively. When someone says “here is a LUT for my preset pack”, they almost always mean a .cube file.
Technical Specifications
Getting Started in 30 Seconds
Navigate to alestemple.net/tools/lut-analyzer.html in your browser (Chrome, Edge, Firefox, or Safari). No installation required - the tool runs entirely in your browser using WebGL and Web Workers.
Upload your .cube file by dragging and dropping it onto the drop zone or clicking "Upload .cube LUT file" to browse. Files up to 20 MB in any standard .cube format are supported.
Instantly view six analysis tabs: 3D Cube, Curves, Preview, Scopes, DNA, and Compare (optional). All analysis runs locally - your LUT never leaves your device.
Privacy first: Your .cube file never leaves your device. All analysis runs locally in your browser. We do not upload, store, or inspect your files in any way.
Feature Comparison: What Each Tab Does
| Analysis View | Primary Purpose | Key Metrics | Best For |
|---|---|---|---|
| 3D Cube | Spatial gamut transformation visualization | 12 colour modes (ΔE2000, Jacobian, RGB, HSV) | Overall gamut behavior, colour temperature, saturation shifts |
| Curves | Per-channel tonal response | R/G/B tone curves, contrast, clipping zones | Understanding contrast, black point, colour casts by tonal zone |
| Preview | Real-world before/after evaluation | Pixel Inspector, false-colour clip warning | Testing on your actual footage, skin tone verification |
| Scopes | Broadcast-grade signal analysis | Waveform, Vectorscope, Histogram, CIE xy, Saturation Response | Ensuring broadcast-legal output, detecting colour shifts |
| DNA | Automatic LUT fingerprinting | Gamut Volume (Jacobian), Hue Map, Skin Tone Score | Quick LUT classification, pack comparison, documentation |
| Compare | Side-by-side LUT comparison | Perceptual similarity, delta metrics, dual 3D overlay | Finding the right LUT from a pack, understanding LUT differences |
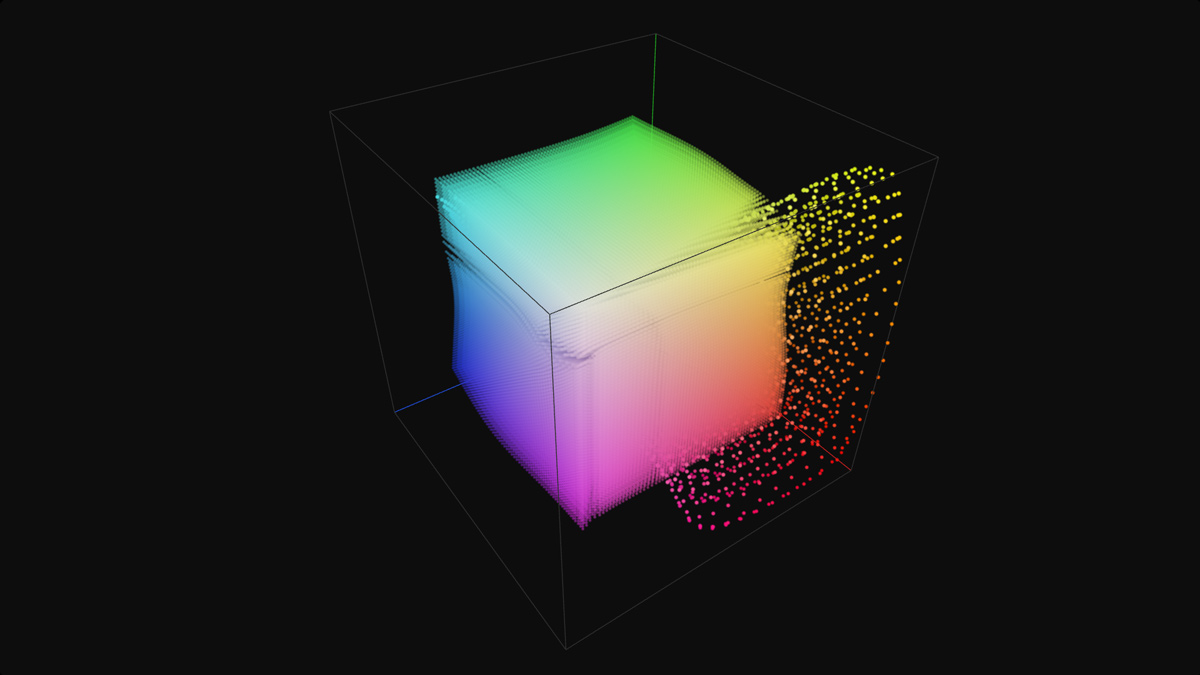
Tab 1 – 3D Cube: Spatial Gamut Analysis
The 3D Cube tab renders the LUT’s colour transformation as an interactive point cloud in a 3D RGB colour space. Each of the LUT’s grid points is plotted according to its output colour value. An untransformed identity LUT produces a perfect, evenly distributed cube. A creative LUT distorts, stretches, rotates, and compresses that cube in ways that directly correspond to its colour behaviour.
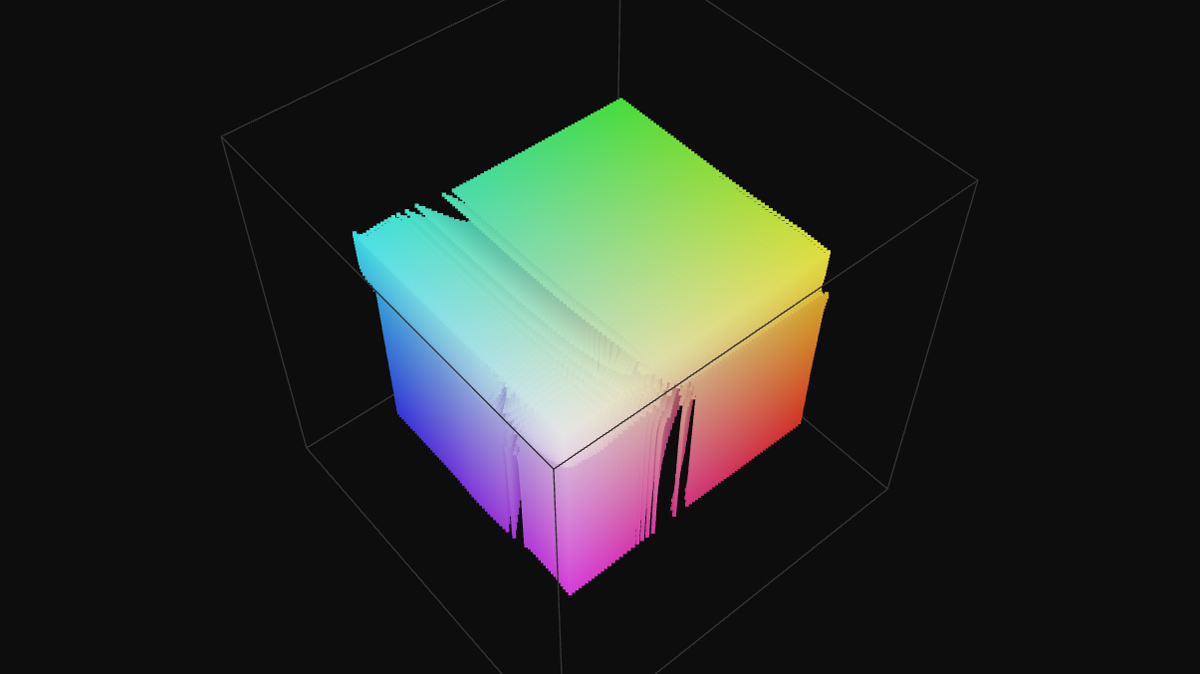
3D Cube tab – 12 colour encoding modes including ΔE2000 (perceptual), Jacobian (gamut volume), and standard RGB/HSV modes with zone filters and dual-LUT overlay.
Display Modes (How Points Are Drawn)
Display Modes
Points mode plots each node at its output position; hover any node to read exact input → output RGB values and the per-channel deviation at that point. Vectors mode draws arrows from each node’s input position to its output position - arrow length corresponds directly to transformation magnitude. Lattice mode connects neighbouring nodes with a wireframe, making grid distortions and local non-linearities immediately visible.
Colour Encoding Modes (What Colours Mean)
12 Colour-Encoding Modes
Output RGB and Input RGB for direct colour reading.
Heatmap for overall shift magnitude (blue = small change, red = large change).
R / G / B Shift for per-channel output level (0–255 mapped to colour).
ΔR / ΔG / ΔB - diverging delta maps: blue = pushed down, grey = neutral, red = pushed up. Instantly spot which channels are boosted or suppressed at each point.
ΔE2000 - perceptually uniform colour difference. Shows how much the LUT changes perceived color, weighted to match human vision. More accurate than RGB distance for skin tones and critical colours.
Jacobian Determinant - measures gamut volume scaling. Values > 1.0 = expansion (saturation boost); < 1.0 = compression (desaturation). Identifies over-compressed colour families.
Dev. Identity - encodes shift direction as a normal-map colour for diagnosing the angle of deviation across the gamut.
Overlay Tools
Advanced Tools
Zone Filter (Shadows / Midtones / Highlights) with optional Soft Zone gradient blend at boundaries - isolate and inspect how the LUT treats specific tonal regions.
Gamut Boundaries - overlay DCI-P3 and Rec.2020 wireframes to visualize the LUT output against professional colour gamut standards.
Neutral Axis - overlays the grey spine with per-grey deviation markers to quantify colour casts on neutral tones.
Compare B - superimposes a second LUT as a translucent ghost overlay for direct 3D gamut shape comparison.
AB-Diff Vector Mode - shows arrows pointing from LUT A to LUT B for each point, revealing exactly how two LUTs differ spatially.
2D Slice Views - extract 2D slices along R, G, B axes to analyze behaviour in specific colour planes.
Clip Overlay - marks out-of-range nodes in red (values > 1.0 or < 0.0).
±Shift Size - scales point size by shift magnitude; larger dots = bigger transformations.
Blend Identity - crossfades toward the identity cube to gauge transformation intensity.
Auto-Rotate - automatic full 360° spin for hands-free inspection.
At a glance: A uniform expansion away from centre = global saturation increase. A vertical translation of the shadow cluster = black lift or crush. A skew toward a warm corner = colour temperature push. Corners pushed outside the cube boundary = output clipping that will burn highlights or crush shadows on real footage. ΔE2000 heat shows perceptual impact; Jacobian shows which colours are over/under-saturated.
Tab 2 – Curves: Tonal Behaviour Per Channel
The Curves tab samples the LUT along the neutral axis (R=G=B) and plots the per-channel response curves for Red, Green, and Blue independently. This is the fastest way to read the LUT’s tonal contract: where it adds contrast, where it lifts the blacks, and whether it introduces a colour temperature shift in specific tonal zones.
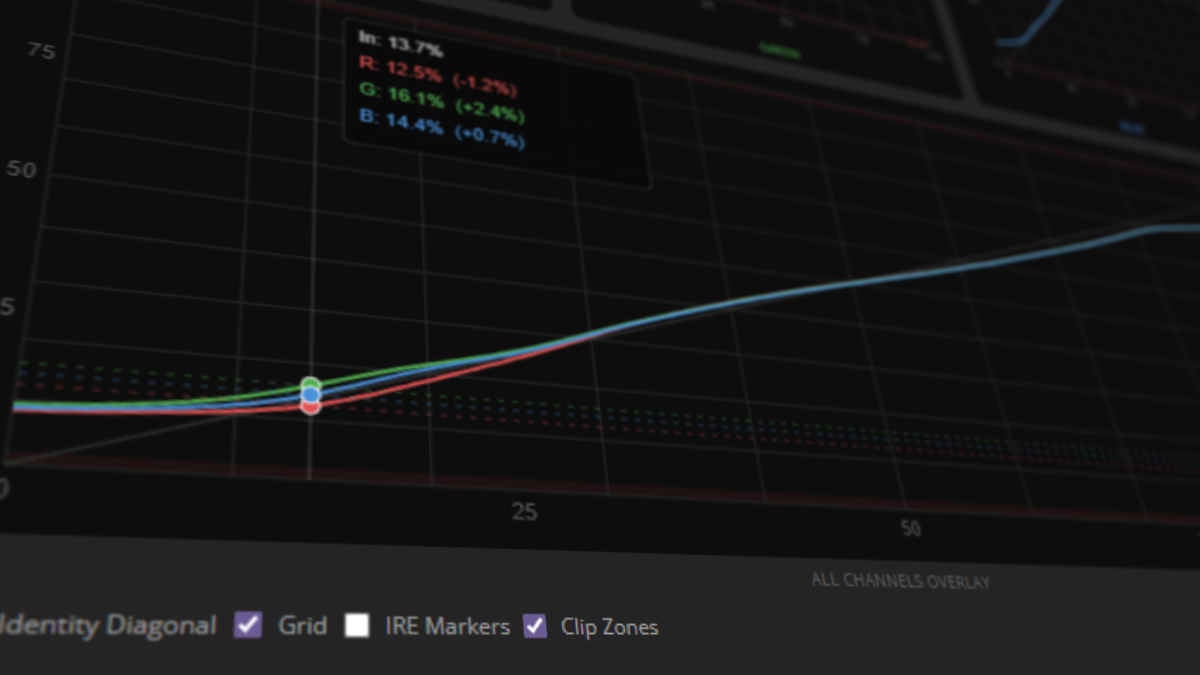
Curves tab – Per-channel R, G, B tone response with IRE broadcast markers, clipping zones, grid overlay, and identity diagonal reference.
Curves Analysis
Three individual channel canvases (Red, Green, Blue) plus an All Channels Overlay view for direct cross-channel comparison. Hover any canvas to read the exact input level, per-channel output, and deviation from identity at that point.
Tonal signatures: An S-curve = contrast boost; steeper S = more aggressive compression in the toe and shoulder. A flattened curve = log-style roll-off or low-contrast treatment. When R and B diverge significantly in the highlights, the LUT introduces a warm cast; convergence in the shadows often reveals a cool lift.
IRE Markers overlay broadcast-legal reference lines at black (7.3%), midtone (64%), and white (92.1%) - essential when grading for broadcast delivery targets.
Clip Zones shade the top and bottom 2% to flag where output values will hard-clip on real footage.
Grid and Identity Diagonal toggles aid precise visual measurement.
Tab 3 – Preview: Before / After with Pixel Inspector
The Preview tab renders a live before/after split view. You can evaluate the LUT against the built-in synthetic test layers (Hue Matrix, Grey Ramp, Skin Tone patches, Banding Test) or - and this is the most useful option - upload your own JPEG, PNG, or WebP image to see exactly how the LUT performs on real footage from your actual project.
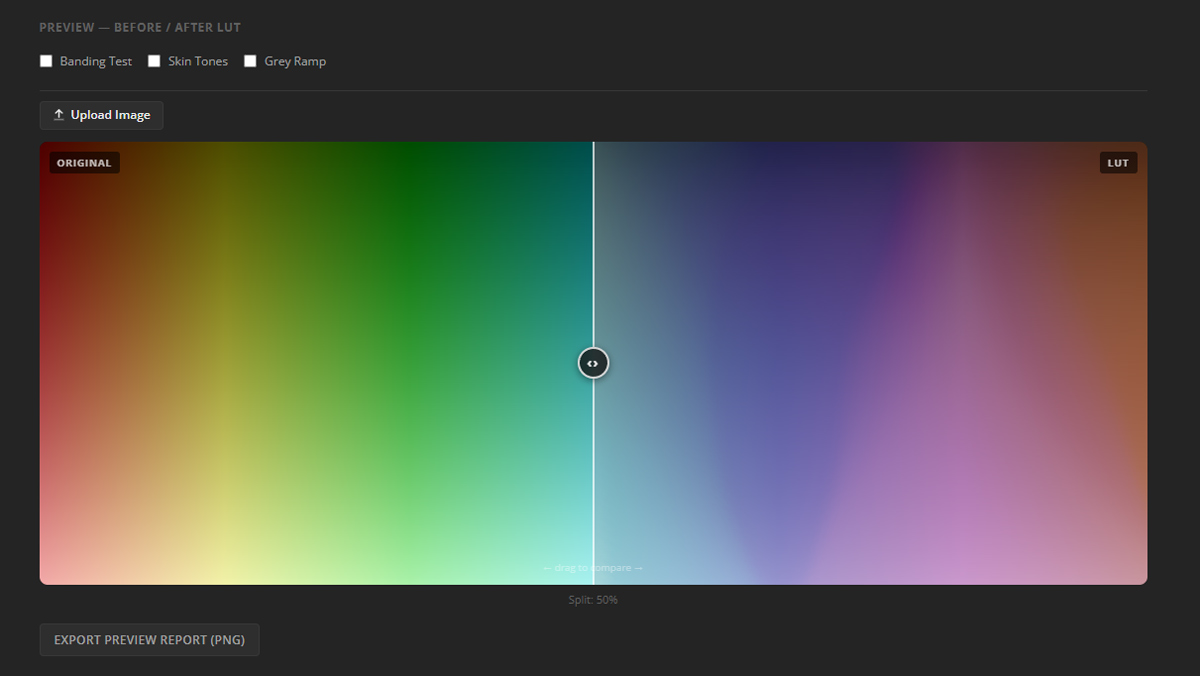
Preview tab – Draggable split view with Pixel Inspector (hover for RGB values) and false-colour clip warning. Image processed 100% in-browser.
Pixel Inspector
Pixel-Level RGB Inspection
Hover over any pixel in the before/after preview to instantly read exact RGB values before and after the LUT is applied. The inspector shows:
- Before values: Original RGB
- After values: RGB after LUT
- Delta: Change per channel
- False-colour warning: Flags out-of-range values (clipped)
Essential for verifying the LUT's impact on critical colours like skin tones, neutrals, and highlights.
False-Colour Clip Warning
Automatic Out-of-Range Detection
When the LUT produces output values outside 0–255, the preview highlights the affected pixels in a distinct false colour (typically magenta or yellow). This instantly reveals:
- Highlight clipping (values > 255)
- Shadow crushing (values < 0)
- Which parts of your image will be affected
Use this to decide whether the LUT is too aggressive for your footage or if opacity adjustment is needed.
Image Upload Options
Supported Formats & Sizes
Synthetic layers (built-in, no upload needed):
- Hue Matrix: Full 0–360° hue sweep at multiple luminance levels. Fastest way to spot hue rotation artefacts.
- Grey Ramp: Pure neutral tones. Reveals colour casts on greys.
- Skin Tones: 36 reference skin colours. Most colour-critical region in human footage.
- Banding Test: Smooth gradients. Detects posterization or banding artefacts.
Custom images: JPEG, PNG, or WebP up to 20 MB. For most accurate evaluation, upload a representative still frame exported directly from your NLE timeline in the same colour space and exposure as your grading footage.
Tab 4 – Scopes: Broadcast-Grade Signal Analysis
The Scopes tab runs the LUT through a 32³ test signal (32,768 unique RGB combinations covering the full colour cube) and renders five professional broadcast scopes. This gives you the same analytical depth used in professional colour suites, without needing a dedicated monitoring solution or NLE plugin.
Scopes tab – Five professional broadcast scopes derived from 32³ test signal: Waveform, Vectorscope, Histogram, CIE xy Chromaticity, and Saturation Response.
Five Scopes
Waveform (RGB Parade / Luma / Overlay) - read the output exposure distribution and check for highlight clipping or shadow crushing. Parade mode shows all three channels independently for per-channel analysis.
Vectorscope with 75% and 100% colour bar targets - read saturation output and hue bias direction. Tells you instantly whether the LUT shifts reds toward magenta, greens toward cyan, etc.
Histogram (RGB / Luma / Log Scale) - distribution across the full tonal range. Log scale reveals shadow and highlight behaviour more clearly.
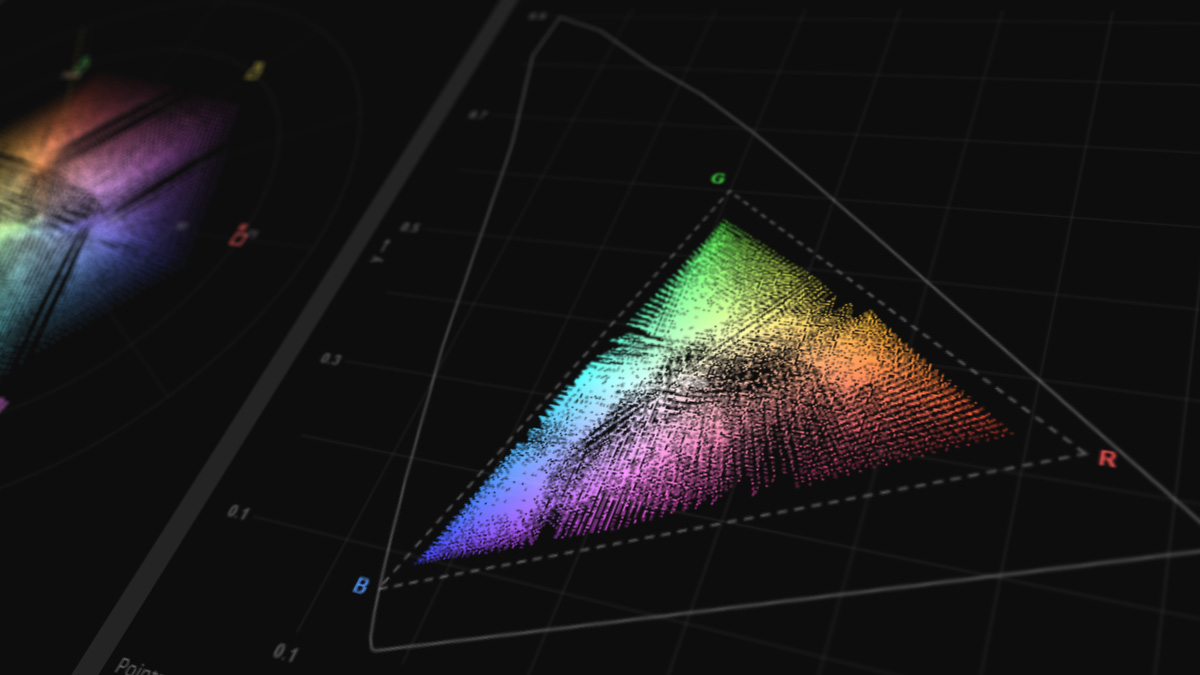
CIE xy Chromaticity - output plotted on the 1931 CIE xy diagram with sRGB/Rec.709 (white dashed) and DCI-P3 (purple dashed) gamut boundaries, D65/D50/D55 illuminant markers, Planckian locus from 2,000 K to 10,000 K, and red points marking out-of-range output values.
Saturation Response - input chroma vs output chroma sampled from 720,000 HSV combinations for smooth, continuous curves coloured by hue. Shows exactly which colour families the LUT over- or under-saturates and by how much.
Tab 5 – LUT DNA: Automatic Fingerprinting
The LUT DNA tab produces a fully automatic mathematical profile of the loaded LUT - no manual reading, no filename interpretation. It is the analytically deepest feature in the tool and unique among browser-based LUT analysers. Every number derives directly from the LUT’s data.
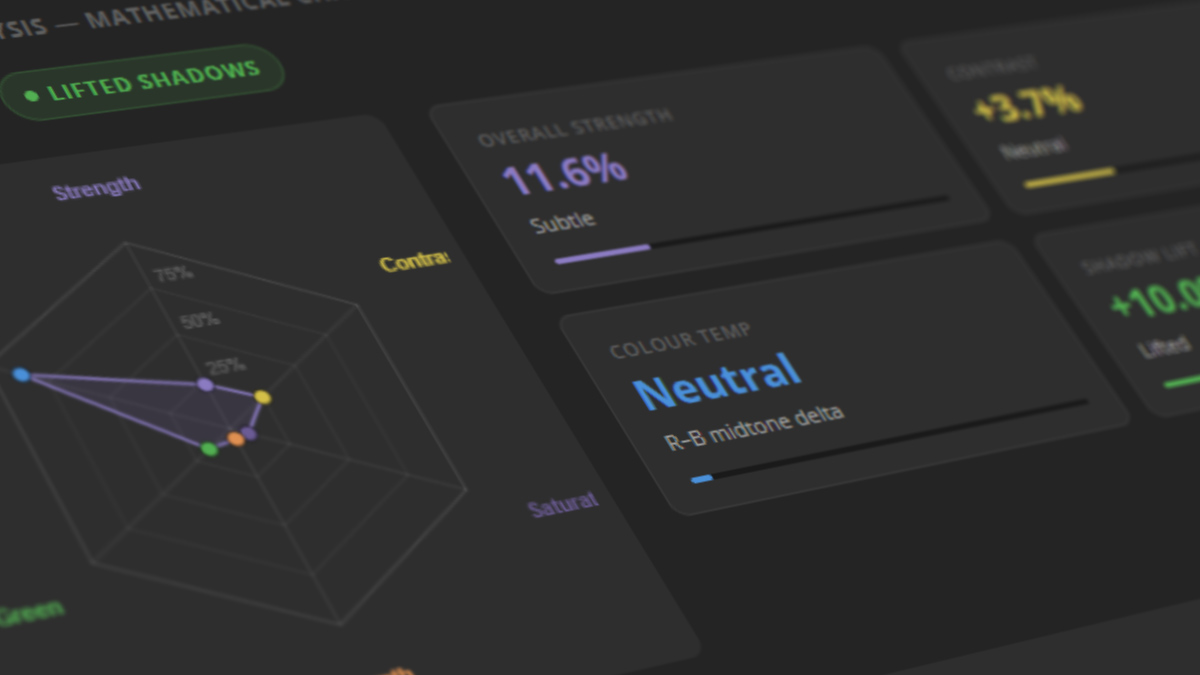
LUT DNA tab - Seven key metric tiles, six-axis radar chart, DNA Signature hash, twelve-sector Hue Rotation Map, Skin Tone Preservation, Channel × Zone breakdown, and Use Case Classifier.
DNA Components
Automatic Analysis Outputs
Six-axis Radar Chart: Strength (overall transformation magnitude), Contrast (S-curve aggressiveness), Saturation (colour intensity change), Warmth (red/yellow push), Green Push (specific green channel bias), Smoothness (gradient uniformity). Each axis scored 0–100.
Seven Metric Tiles:
- Gamut Volume: Jacobian determinant-based measurement of overall gamut expansion/compression.
- Output Range: Min/max RGB values produced.
- Clipping Risk: Percentage of grid points producing out-of-range values.
- Black Point: Lowest output in the shadow region.
- White Point: Highest output in the highlight region.
- Hue Rotation: Average hue shift across the full colour wheel.
- Chromatic Shift: Average saturation change.
DNA Signature: Compact hash encoding all six radar values. Useful for version control and duplicate detection.
Twelve-Sector Hue Rotation Map: Per-sector hue shift (Reds, Oranges, Yellows, Greens, Cyans, Blues, Magentas, etc.) with CW/CCW rotation indicators.
Skin Tone Preservation: Score based on how well the LUT preserves 36 reference skin colours.
Channel × Zone Breakdown: Per-channel and per-zone (shadows/mids/highlights) analysis table.
Chromatic Neutrality Gauge: How well neutral colours stay neutral.
Use Case Classifier: Auto-suggested application (Film Emulation, Log Recovery, Stylization, etc.).
Auto-Generated Tags: Warm, Lifted Shadows, Film Emulation, Gamut Compressed, Strong LUT - derived entirely from measured values, never from filename.
LUT Character Summary: Plain-language description suitable for copying into metadata or client delivery documents.
Warnings Section: Highlight clipping (> 1.0), shadow crushing (< 0.0), near-blocked shadows, excessive strength with practical 60–80% opacity guidance.
Tab 6 – Compare: Side-by-Side LUT Analysis
The Compare tab loads a second .cube file and runs a full-gamut analytical comparison between LUT A (the current file) and LUT B - RGB tone curves, perceptual similarity scoring, per-channel delta metrics, and a difference curve. This is the fastest way to find the right LUT from a pack or understand exactly how two LUTs differ.
Compare tab - Load LUT B, compare curves in Side-by-Side or Overlay mode, read similarity scores and delta metrics. 3D Cube tab also shows LUT B as translucent ghost overlay.
Comparison Features
Curve Viewing Modes:
- Side-by-Side: Each LUT on its own canvas for independent reading.
- Overlay Mode: Both on a single canvas (LUT A solid, LUT B dashed) for direct visual alignment.
Similarity Score: Luma-weighted perceptual similarity sampled from 32,768 RGB combinations. Shows how different the two LUTs are on a scale (0 = completely different, 100 = nearly identical).
Per-Channel Deltas: For each channel (R, G, B), see min, max, and average deviation between LUT A and LUT B.
Difference Curve: Visualizes deviation magnitude across the tonal range.
3D Gamut Overlay: When LUT B is loaded, switch to the 3D Cube tab and enable "Compare B" to see LUT B as a translucent ghost overlay. The only browser-based view where two LUTs can be compared as three-dimensional gamut shapes simultaneously.
Professional Use Cases
Here are practical scenarios where each analysis tab becomes indispensable:
Colorist Evaluating a Film Emulation LUT
Use: 3D Cube (ΔE2000 mode) + Curves + Scopes. Check for realistic skin tone shift (ΔE2000), verify S-curve for film-like contrast, scan vectorscope for hue bias. The Pixel Inspector confirms exact RGB shift on skin.
Photographer Testing LUT in Lightroom/Capture One
Use: Preview tab (upload sample JPEG) + DNA. Instantly see before/after on real work. DNA tags and character summary become your metadata - copy directly into your presets documentation.
YouTuber Comparing 5 LUTs from a Pack
Use: Compare tab. Load LUT #1, then LUT #2, read similarity scores. Repeat for #3, #4, #5. In 3 minutes, you know which two are nearly identical and can skip redundant ones.
DIT Checking LUT for Broadcast Compliance
Use: Curves (IRE markers) + Scopes (Waveform + Histogram). Verify output stays within 0–255. Saturation Response shows which colours might exceed legal limits.
LUT Designer Testing Gamut Compression
Use: 3D Cube (Jacobian mode) + DNA (Gamut Volume). See exactly which colour families are compressed and by how much. 2D Slice views isolate specific colour planes.
Asset Manager Cataloging 100-LUT Library
Use: DNA tab + export as PNG. Run DNA on each LUT, save the report. Use the DNA Signature hash and LUT Character to build a searchable database. One click = full analytical metadata.
60-Second Evaluation Workflow
This is the fastest practical workflow for evaluating an unknown LUT from a pack, from load to decision - takes about 60 seconds:
Load the LUT (5 seconds). Drag it onto alestemple.net/tools/lut-analyzer.html
Check DNA tab (10 seconds). Scan the radar chart, metric tiles, and Use Case Classifier. Read the LUT Character summary. You now know: Is this a warm or cool LUT? Is it aggressive or subtle? What is it designed for?
Scan 3D Cube in ΔE2000 mode (15 seconds). Rotate the view. Look for large red clusters (big perceptual shift). Enable Zone Filter to isolate shadows - do you see black lift? This gives you spatial intuition instantly.
Check Curves tab (10 seconds). Is there an S-curve (contrast)? Is the curve symmetric (balanced) or skewed (log-like)? Do the R and B channels diverge (colour temperature bias)?
Upload a sample image in Preview tab (15 seconds). Look at skin tones. Use the Pixel Inspector to read exact RGB before/after on a skin pixel. Check the false-colour clip warning - are there warning pixels?
Decide (5 seconds). Based on DNA (what it is), 3D Cube (how it transforms), Curves (contrast), and Preview (real-world result), you now have enough information to decide: Is this the LUT you need? Do you need to adjust opacity? Or do you skip it and try the next one?
Pro tip: Bookmark the analyzer and re-use it. Once you've analyzed 5–10 LUTs, your intuition for reading the 3D Cube, Curves, and DNA becomes fast and automatic. After that, you can often decide in 20–30 seconds.
Advanced Features FAQ
ΔE2000 vs. Standard RGB Distance - Why Does It Matter?
Standard RGB distance treats all colour shifts equally. ΔE2000 (Delta E CIE 2000) is a perceptually uniform metric that weights colour differences the way human eyes perceive them. For example:
- A shift in skin tone from (220, 180, 160) to (218, 178, 158) looks significant to the eye - ΔE2000 weights it heavily.
- A shift in deep blue from (20, 20, 100) to (18, 18, 98) is mathematically similar but barely noticeable - ΔE2000 weights it lightly.
Use ΔE2000 mode when evaluating creative or film-emulation LUTs. It tells you which colours will actually look different to viewers, not just which are mathematically different.
Jacobian Determinant - What's the Practical Use?
Jacobian Determinant measures how much the LUT scales colour volume at each point:
- Value > 1.0: LUT expands colours (increases saturation). High values in reds might mean over-saturated reds.
- Value < 1.0: LUT compresses colours (decreases saturation). Common in highlight regions to prevent oversaturation.
- Value = 1.0: No change in saturation at that point.
Use this to diagnose whether a LUT is over-compressing certain colours. Example: A film LUT might over-compress greens (Jacobian < 0.7) to prevent fake-looking foliage. Now you know - and can decide if that's right for your footage.
Can I Use the Preview Tab Without Uploading My Entire Footage?
Yes. The synthetic test layers (Hue Matrix, Grey Ramp, Skin Tones, Banding Test) are built-in. They cover 95% of real-world evaluation scenarios without any upload. Upload your own image only if you want to test on actual footage from your project - and even then, it's optional.
What Does "Clip Overlay" Mean in the 3D Cube?
Some LUTs produce output values outside the valid 0–255 range (e.g., 256 or -1). The Clip Overlay highlights these problematic grid points in red. If you see red dots:
- The LUT will hard-clip real footage at those colours.
- You may need to reduce opacity (e.g., 80% instead of 100%) to avoid visible clipping.
- Or you should skip this LUT if clipping is unacceptable for your project.
Why Are My File's Scopes Showing Something Unexpected?
The Scopes tab derives from a 32³ test signal (32,768 unique RGB combinations). If you see unexpected spikes:
- Your LUT might have a subtle gamut boundary or non-smooth interpolation.
- Zoom in on the waveform to see exactly which tones are affected.
- Use the CIE xy diagram to check if colours are being pushed outside the colour space.
What's the Difference Between "Compare B" in 3D Cube and the Full Compare Tab?
"Compare B" in 3D Cube: Shows LUT B as a translucent ghost overlay in the same 3D space as LUT A. Visual, intuitive, great for understanding gamut shape differences.
Compare tab: Shows detailed metrics - similarity scores, per-channel deltas, curve comparison, etc. Analytical and numerical. Use it to quantify differences, not just visualize them.
Combined: Use 3D overlay first for intuition ("LUT B is shifted more toward warm"), then Compare tab for numbers ("LUT B shifts reds by +12, greens by -8, blues by +5").
Can I Export the LUT DNA Report?
Yes. The LUT DNA tab includes an "Export as PNG" button. The report includes all radar values, metrics, warnings, and character summary. Perfect for documentation, client delivery, or building a LUT library database.
Does the Tool Support 3DLUT or HDR LUTs?
Currently, the tool supports standard .cube files in rec709/sRGB colour spaces (17³ – 65³). HDR (Rec.2020, HDR10, ACES) and alternative formats (3DLUT, .vlt) are not currently supported, but this is planned for future updates.
Ready to Analyze Your First LUT?
Open the free LUT Cube Analyzer now and load any .cube file from your preset packs. No account, no upload, no software to install.
Go to LUT Analyzer